Are the meant to enlighten or to mislead? What is the problem with this graph? Does it mislead, or inform?
Here are some more.
And here is a post on the historical changes in the goals of data visualization.
Showing posts with label visualization. Show all posts
Tuesday, November 27, 2012
Tuesday, October 30, 2012
Wind Visual
An amazing visualization of the wind. The screen capture below is from the morning after hurrican Sandy made land.
Sunday, October 21, 2012
Ugly Graphs
This website is painful. It burns my eyes. It contains a plethora of hideous graphs, nearly all 3-d. Its hard to pick the worst, but the one below has to be a front runner.
Monday, February 27, 2012
Dog Names and Breeds
I love data. As an Economist and Professor you sometimes find yourself with interesting datasets that need to be shared. I have a group of students doing a project for a dog daycare in town. In order to survey dog owners we got the list of dog licenses from the county. It has the name, address of the owner, and the name, sex and breed of the dog. Below we have the top 20 names for dogs in La Crosse County for 2012. Remember these are licensed dogs.
Below I have the top 20 breeds from La Crosse.

Below I have the top 20 breeds from La Crosse.

Monday, January 23, 2012
What Not To Do
A great example of how not to design and deliver a presentation. In this commercial Microsoft demonstrates why they suck, or at the very least why their Ad Agency sucks.
Monday, July 18, 2011
Wednesday, December 01, 2010
Friday, May 28, 2010
Tuesday, March 09, 2010
Infographic on Porn
As is always the case with data on the porn industry, this should be viewed with a healthy dose of skepticism. Same is true for the youtube video below. The video is risque, but no nudity. However it might not pass your employer's test, so in that case consider it NSFW. It is a unique way to view data. I wonder if I did this with my power point slides for class what would happen? They probably would still miss the message.
Monday, March 08, 2010
Monday, March 01, 2010
Linkfest
1. The future is here, and it involves analyzing data. In this case, predicting movements with cell phones.
2. An awesome visualization, well audio-ization of the time differences in Olympic sports.
3. The problems with the GOP.
4. The challenges facing employment growth.
2. An awesome visualization, well audio-ization of the time differences in Olympic sports.
3. The problems with the GOP.
4. The challenges facing employment growth.
Thursday, February 18, 2010
Presentations
Deliver a great presentation like Steve Jobs. And while you are at it use some color theory when creating your slides.


Monday, October 26, 2009
Useful Posts
Here are a few posts that BUS 230 students should find useful over the coming weeks.
Nancy Duarte on "Creating Waves" in presentations.
Seth Godin on making graphs that work.
Garr Reynolds on the art of the "Focal Point" and the art of "Less" in presentation design.
And two on the value of data visualization. Here and here.
Nancy Duarte on "Creating Waves" in presentations.
Seth Godin on making graphs that work.
Garr Reynolds on the art of the "Focal Point" and the art of "Less" in presentation design.
And two on the value of data visualization. Here and here.
Monday, October 12, 2009
Sunday, April 05, 2009
Wednesday, February 18, 2009
A Simple Regression
For my econometrics class. Here is a nice example of a simple regression and an excellent graph.
Monday, November 10, 2008
Visualizing the Election
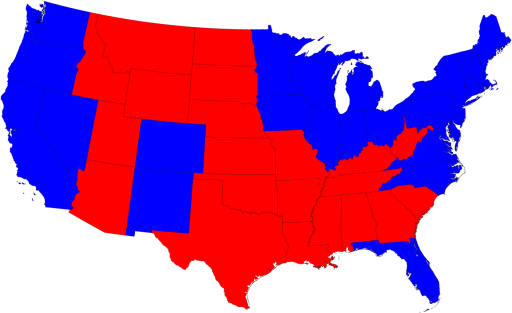
CNN and other news outlets would have you believe this is still a divided country with red states and blue states.
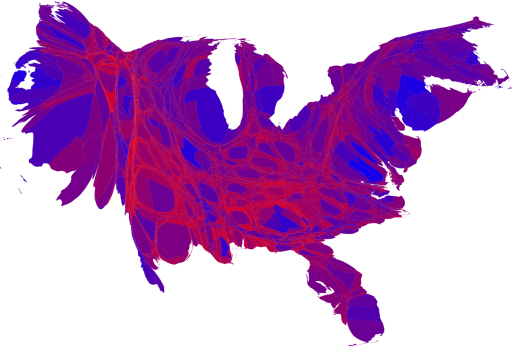
But a better visualization would shade the areas based not upon who won the state, but by the degree to which they won the state. And the states themselves shouldn't be represented as a function of their geographic size, but rather the size of their population. Here we have just such a picture, and its clear, we are all purple now. More can be found here.
Subscribe to:
Posts (Atom)