Friday, December 14, 2012
P-Hacking
A reminder of the cult of statistical significance. I fear my teaching sometimes leads students to honor the wrong idols.
Thursday, November 29, 2012
Ted Talk Secrets
Here is an article on what makes Ted Talks so great.
3. How can anybody learn to tell stories that are as enthralling as a TED Talk?
The first thing to know is that there's no one formula or way to give a TED Talk. They're as unique as the speakers themselves. The real key is authenticity. TED Talks work when speakers share both their personality and their original ideas with the audience. You can't just lecture. You have to be passionate; you have to be willing to be vulnerable. This doesn't mean giving the audience jazz hands or shedding crocodile tears. It means sharing your curiosity and your excitement, your failures along with your successes. It’s also about telling stories that take the audience on a journey. And allowing your own contagious enthusiasm to inspire the audience in their own work. And helping the audience to see the world through your eyes. If you can get people to see the world differently, then that’s a talk that will be truly memorable.
All that said, a great TED Talk also takes PRACTICE. With very limited time (only 18 minutes or less), you have to know your material inside and out, so you can present in a way that feels polished but -- importantly -- not rehearsed. You have to practice with real audiences so you get the feel for the rhythm of a talk: When are they riveted? When do you lose them? It's only by test-driving a talk that you can learn what works and what doesn't.
In the end, TED Talks are about great, old-fashioned human storytelling.Here are the top 20 most watch Ted Talks to date.
Tuesday, November 27, 2012
Graphs
Are the meant to enlighten or to mislead? What is the problem with this graph? Does it mislead, or inform?

Here are some more.
And here is a post on the historical changes in the goals of data visualization.
Here are some more.
And here is a post on the historical changes in the goals of data visualization.
Tuesday, October 30, 2012
Wind Visual
An amazing visualization of the wind. The screen capture below is from the morning after hurrican Sandy made land.


Friday, October 26, 2012
Wednesday, October 24, 2012
Sunday, October 21, 2012
Ugly Graphs
This website is painful. It burns my eyes. It contains a plethora of hideous graphs, nearly all 3-d. Its hard to pick the worst, but the one below has to be a front runner.

Learning R
I'm in the process of learning R. This post nails my reaction to finally learning a real programming language.
Stata seems to have been designed to make sense to social scientists and if this makes it confusing to programmers, then so be it. A simple example of this is that Stata uses the word “variable” in the sense meant by social scientists. More broadly, Stata is pretty bold about defaults so as to make things easy for beginners. It presumes that anything you’re doing applies to the dataset (aka the master data) – which is always a flat-file database. Other things that might be held in memory have a secondary status and beginning users don’t even know that they’re there. Likewise, commands distinguish between the important arguments (usually variables) and the secondary arguments, which Stata calls “options”. There’s also the very sensible assumptions about what to report and what to put in ephemeral data objects that can be accessed immediately after the primary command (but need not be stored as part of the original command, as they would in most other languages).
Note, I’m not complaining about any of this. Very few of Stata’s quirks are pointlessly arbitrary. (The only arbitrary deviation I can think of is using “*” instead of “#” for commenting). Most of Stata’s quirks are necessary in order to make it so user-friendly to social scientists. In a lot of ways R is a more conventional language than Stata, but most social scientists find Stata much easier to learn. In part because Stata is willing to deviate from the conventions of general purpose programming languages, running and interpreting a regression in Stata looks like this “reg y x” instead of this “summary(lm(y~x))” and loading a dataset looks like this “use mydata, clear” instead of this “data <- read.table(mydata.txt)”. Stata has some pretty complicated syntax (e.g., the entire Mata language) but you can get a lot done with just a handful of simple commands like “use,” “gen,” and “reg”.
Wednesday, October 17, 2012
ECO 712: Week 7 Readings
This week readings from Paige:
Olive Oil Prices: Drizzle and drought.
Here is another that will be useful to think about after the lecture: IS-LMentary.
Olive Oil Prices: Drizzle and drought.
Here is another that will be useful to think about after the lecture: IS-LMentary.
Friday, October 05, 2012
Stimulus
Here is an excellent compendium of the recent recent on the effects of stimulus spending.
In this post, I’ve pulled together my summaries of the original nine papers, and added sections on the six new additions to the literature. The critical issue in these studies concerns the “fiscal multiplier” — that is, how much bang the government gets for its stimulus buck. For example, if each dollar spent on a particular kind of tax cut results in a $1 increase in GDP, the multiplier for that tax cut is 1. Any multiplier that is greater than zero indicates a program is stimulative, but the higher the multiplier, the more effective stimulus spending is.Here a a reply of sorts. It points out the limitations of the research, by noting the following:
Stimulus Advocates Largely Ignore the Public Choice Problems with Implementing Stimulus.
Stimulus Advocates Often Brush Past Long Run / Short Run Distinctions.

Wednesday, October 03, 2012
ECO 712: Week 5 readings
Here are the readings for this week:
Counterfeit goods becoming more dangerous.
From tequila crisis to sunrise.
Note: I will likely let class out early so you can all have your popcorn popped and ready to go for the 8pm Presidential Debate. The debate is scheduled to cover domestic policy. Given we are still at an level of employment below the level of December of 2007, you can bet that Jobs will be something you hear often.Take notes. We will discuss their proposals the following week after the exam.
Wednesday, September 26, 2012
ECO 712: Week 4 Readings
The articles for this week:
Article #1 Local employment expected recovery 2017.
Article #2: Inflation in India.
Extra Credit: Point out all the crazy economic ideas in this analysis
Wonkblog has an interesting graph:

Article #1 Local employment expected recovery 2017.
Article #2: Inflation in India.
Extra Credit: Point out all the crazy economic ideas in this analysis
Wonkblog has an interesting graph:
Tuesday, September 25, 2012
DWL
Apparently the editorial board at the New York Times doesn't understand Deadweight Loss. The say:
Voters don’t react positively when a candidate speaks incomprehensibly about taxes, as Mr. Romney did on “60 Minutes.” He said he would lower everyone’s tax rate by 20 percent but that everyone would wind up paying essentially the same taxes because he would limit unspecified deductions and exemptions. Even on its face, that makes little sense. If everyone will pay the same taxes, how does that stimulate growth or reduce unfairness? In fact, tax experts say the rate cut is such a huge benefit for the rich that it can’t be balanced by curbing their deductions. But listeners don’t have to do the math to calculate how fundamentally hollow the proposal is.I'm not arguing that the cut in rates (and here I assume he was specifically referring to the top marginal rate) will actually be revenue neutral, though Feldstein and Rosen argue its feasible. Krugman and others suggest the cut in top marginal rates is too large to be offset by base broadening. I am suggesting, if it were possible it is easy to think about how that stimulates growth and reduces unfairness. Think of lower top marginal rates lowering the incentive to hide income as an example.
Declining Health
Health problems are education problems.
Differences In Life Expectancy Due To Race And Educational Differences Are Widening, And Many May Not Catch Up
Differences In Life Expectancy Due To Race And Educational Differences Are Widening, And Many May Not Catch Up
Abstract: It has long been known that despite well-documented improvements in longevity for most Americans, alarming disparities persist among racial groups and between the well-educated and those with less education. In this article we update estimates of the impact of race and education on past and present life expectancy, examine trends in disparities from 1990 through 2008, and place observed disparities in the context of a rapidly aging society that is emerging at a time of optimism about the next revolution in longevity. We found that in 2008 US adult men and women with fewer than twelve years of education had life expectancies not much better than those of all adults in the 1950s and 1960s. When race and education are combined, the disparity is even more striking. In 2008 white US men and women with 16 years or more of schooling had life expectancies far greater than black Americans with fewer than 12 years of education—14.2 years more for white men than black men, and 10.3 years more for white women than black women. These gaps have widened over time and have led to at least two “Americas,” if not multiple others, in terms of life expectancy, demarcated by level of education and racial-group membership. The message for policy makers is clear: implement educational enhancements at young, middle, and older ages for people of all races, to reduce the large gap in health and longevity that persists today.
Friday, September 21, 2012
Half Marathon Finish Times
I'm on the board for the La Crosse Fitness Festival. It was recently announced that we will be suspending the Marathon and running a Half Marathon race starting on Grandad bluff. In order to plan the event start time we wanted to consider the finish times of the 2012 race. Obviously the new course will be faster, and probably the fastest course in the state, but it will give us an idea of how many people finish at any given time and when the majority of runners finish.
Taking the results from 2012 I've computed the total number of minutes totmin.
Fastest runner completed it in 74.01 minutes. The slowest was 227.3 minutes. The race has an official cutoff time of 4 hours. There were 1096 finishers, with an average time of 124.47 minutes. The standard deviation was 23.43minutes.
Percentiles
1% 82.72
5% 90.8
10% 97.25
25% 108.47
50% 122.14
75% 136.68
90% 153.18
95% 168.23
99% 202.23
Below I have some STATA graphs with the distribution of finishers by time. The y axis is frequency(count), the x axis represents total minutes and the bins are 10 minutes wide. I’ve also included one below that which has the bins set at 1 minute wide. So that gives you a sense of at the finish line how many people will finish in a particular minute. The largest was 30 people at 2 hrs 6 minutes. 76% of the runners finish between 1 hour 35min (95min) and 2 hours 25minutes (145min). Only 31 people took longer than 3 hours.
Wednesday, September 19, 2012
ECO 712: WEEK 3 Readings
Here are the readings for tonight, with some others I plan to use if not tonight in the future.
Labor Force Participation
Hating on Bernanke. Paul Krugman
Here are a few more articles I want to keep in the back of there mind. In a scary new paper by Robert Gordon, he lays out the end of growth as we have known it.
Is Economic Growth Over? Robert Gordon
From our discussion last week about the impact the iPhone 5 and its potential impact on GDP, Paul Krugman notes the inherent fallacy with hailing GDP as the measure of well being.
Broken Windows and the iPhone 5 Paul Krugman
Non-Cog Skills Are Important
Below is an excellent episode of "This American Life" which focuses on Heckman's work on non-cognitive skills, or soft skills, or personality, or whatever you would like to call it on life outcomes. Among the many gems in the episode includes some great insight into the failures of the historical ways in which we removed kids from the classroom for "special-ed".
Tuesday, September 11, 2012
ECO 712: WEEK 2 Readings
Two students sent along the following for us to discuss this week:
Boxed in: Global trade has turned down sharply this year. The outlook is pretty bleak, too
Taiwan pins faith on investment to offset falling exports
Both are related to the macro consequences of a decrease in trade.
Boxed in: Global trade has turned down sharply this year. The outlook is pretty bleak, too
Taiwan pins faith on investment to offset falling exports
Both are related to the macro consequences of a decrease in trade.
Friday, September 07, 2012
Science and Organics
A BUS 230 Instructor sends along the following:
Richard Feynman the famous physicist and philosopher of science also makes comments which suggest it is a hard question to really know. A hard question to answer.
I heard this on NPR this morning and I plan on using it soon for my BUS 230 sections. Stanford did some research looking into the benefits of eating organic food and were unable to identify any health benefits and they got all sorts of negative feedback for reporting it. It is a great example of people attacking the data because they do not agree with the results vs looking at the results scientifically and trying to determine why the results do not support their hypothesis. At the end they have someone on to talk about how people get emotionally involved in the idea of organic food and what it represents and how they get defensive when scientific data does not match their perception (their reality). This happens to us when we present research findings all the time which is why I emphasize that the preliminary steps in the research process are so important. If your research questions and methodology is sound, you can defuse the situation when people start attacking the data and redirect them to look at what the data is really telling them, challenge their assumptions, etc...The article is here and you can listen below.
Richard Feynman the famous physicist and philosopher of science also makes comments which suggest it is a hard question to really know. A hard question to answer.
Unemployment Report
While the decrease in the unemployment rate in this morning's employment report seems like it is good news, the devil is in the details. Unemployment fell to 8.1%, but job growth was a paltry 96,000.The problem is that the unemployment rate fell in part because people left the labor market.
The labor force participation rate, or the percentage of Americans who either have a job or are looking for one, fell to 63.5 percent -- the lowest since September 1981.As Bernanke notes in his Jackson Hole Speech.
"The stagnation of the labor market in particular is a grave concern not only because of the enormous suffering and waste of human talent it entails, but also because persistently high levels of unemployment will wreak structural damage on our economy that could last for many years."And the Chicago Fed President Evans makes a plea to do more:
Finding a way to deliver more accommodation — whether it is monetary or fiscal — is particularly important now because delays in reducing unemployment are costly. An unusually large percentage of the unemployed have been without work for quite an extended period of time; their skills can become less current or even deteriorate, leaving affected workers with permanent scars on their lifetime earnings. And any resulting lower aggregate productivity also weighs on potential output, wages and profits for the economy as a whole. The damage intensifies the longer that unemployment remains high. Failure to act aggressively now could lower the capacity of the economy for many years to come.His full speech is here.
... I have outlined some policy actions that I think can take us in the direction of a more vibrant and resilient economy. Given the risks we face, I think it is vital that we make such moves today. I don’t think we should be in a mode where we are waiting to see what the next few data releases bring. We are well past the threshold for additional action; we should take that action now.
Giving Speeches
There is an art to being a good public speaker. Practiced enough to not trip over words, or veer off on a tangent, yet casual enough to not sound too rehearsed. People need to hear sincerity and feel the passion in your voice, not a robotic recitation. At the 2012 DNC convention Bill Clinton gave a good example of how one might deviate from prepared text to deliver just such a speech. The comparison between prepared and contemporaneous remarks is useful.
Wednesday, September 05, 2012
ECO 712 News
I plan to use this space to share links to some of the topical news items I plan to discuss in class.
Here are two article I plan to discuss:
The European Central Bank offers unlimited aid to euro zone members — but only if they behave
Ben Bernanke makes case for Fed to take more action
Here are a couple of graphs from FRED.
Non-Farm Payroll Employment.
Real GDP.
CPI.
Unemployment Rate.
The European Central Bank offers unlimited aid to euro zone members — but only if they behave
Ben Bernanke makes case for Fed to take more action
Here are a couple of graphs from FRED.
Non-Farm Payroll Employment.
Real GDP.
CPI.
Unemployment Rate.
Saturday, September 01, 2012
Tuesday, August 21, 2012
Podcasts For Econ
You can find podcasts for econ here: http://audioecon.com/. I found this NPR episode on welfare for Millionaire farmers interesting.
Thursday, August 16, 2012
Thursday, June 21, 2012
Wisconsin Job Growth By County
A few select Counties and Cities are below, but the rest of the data for the State of Wisconsin are here. I used the employment data available from the DWD. The last month available in the spreadsheet was March of 2012. I calculated the percentage change from 12 months previous, while including total employment and total job growth. Despite having very different political environments in Milwaukee and Waukesha their job growth was identical. Had I chosen different months I would have gotten different quantitative results, but qualitatively they would be similar.
| Area | Date | Employment | 12 Month % Change | 12 Growth in Jobs |
| Adams County | Mar2012 | 8558 | -1.97 | -172 |
| Milwaukee City | Mar2012 | 241491 | 0.34 | 810 |
| Milwaukee County | Mar2012 | 417550 | 0.34 | 1401 |
| Waukesha City | Mar2012 | 36990 | 0.34 | 124 |
| Waukesha County | Mar2012 | 200106 | 0.34 | 671 |
Sunday, June 10, 2012
Race in America
Interesting differences between French and Americans in their views of race:
The movie is about a rich man who is paralyzed in an accident and hires an ex-con from the 'hood as his all-purpose live-in assistant. The fish-out-water pair become friends and Mr. Rich Guy gets his mojo back thanks to the other man's down-to-earth love of life. Poor guy learns to appreciate nice things and classical music. Rich guy learns to enjoy Earth Wind and Fire. The rich man is white, the poor guy is black.
French viewers loved it. American critics saw the servant part as a classic Magic Negro. David Denby, in The New Yorker, for example, complained that the movie is "disastrously condescending: the black man, who’s crude, sexy, and a great dancer, liberates the frozen white man. The film is an embarrassment." Similarly Jay Weissberg in Variety wrote that Driss, the ex-con, "is treated as nothing but a performing monkey (with all the racist associations of such a term), teaching the stuck-up white folk how to get 'down' by replacing Vivaldi with 'Boogie Wonderland' and showing off his moves on the dance floor."
The French reaction to this reaction, as described by Sotinel, must strike Americans as pretty funny. It amounts to this: Oh, yeah, that one guy is black. Leave it to you race-obsessed Americans to pick that up; we hadn't noticed. We didn't really notice that. (Negative French reviews of the film complained that it was hokey, Sotinel writes, but none mentioned skin color.)
Sunday, May 13, 2012
Professional Management
La Crosse recently had a referendum on having a professional manager/administrator. The current county Administrator, Steve O'Malley has taken some heat for advocating for the form of government. The paper ran a story saying Steve asked for an ethics ruling. One could argue that his professional code of ethics from the ICMA requires of him to advocate for professional management.
This research concludes that professional management delivers better fiscal outcomes for cities:

This article however, counters that the evidence is not always so clear.
This research concludes that professional management delivers better fiscal outcomes for cities:

This article however, counters that the evidence is not always so clear.
Tuesday, February 28, 2012
Monkeys and Fairness
Below is an excellent video on pro-social behavior and fairness among monkeys. The good stuff is at 12:00min and 14:40. Monkeys demonstrate interdependent utility functions.
Monday, February 27, 2012
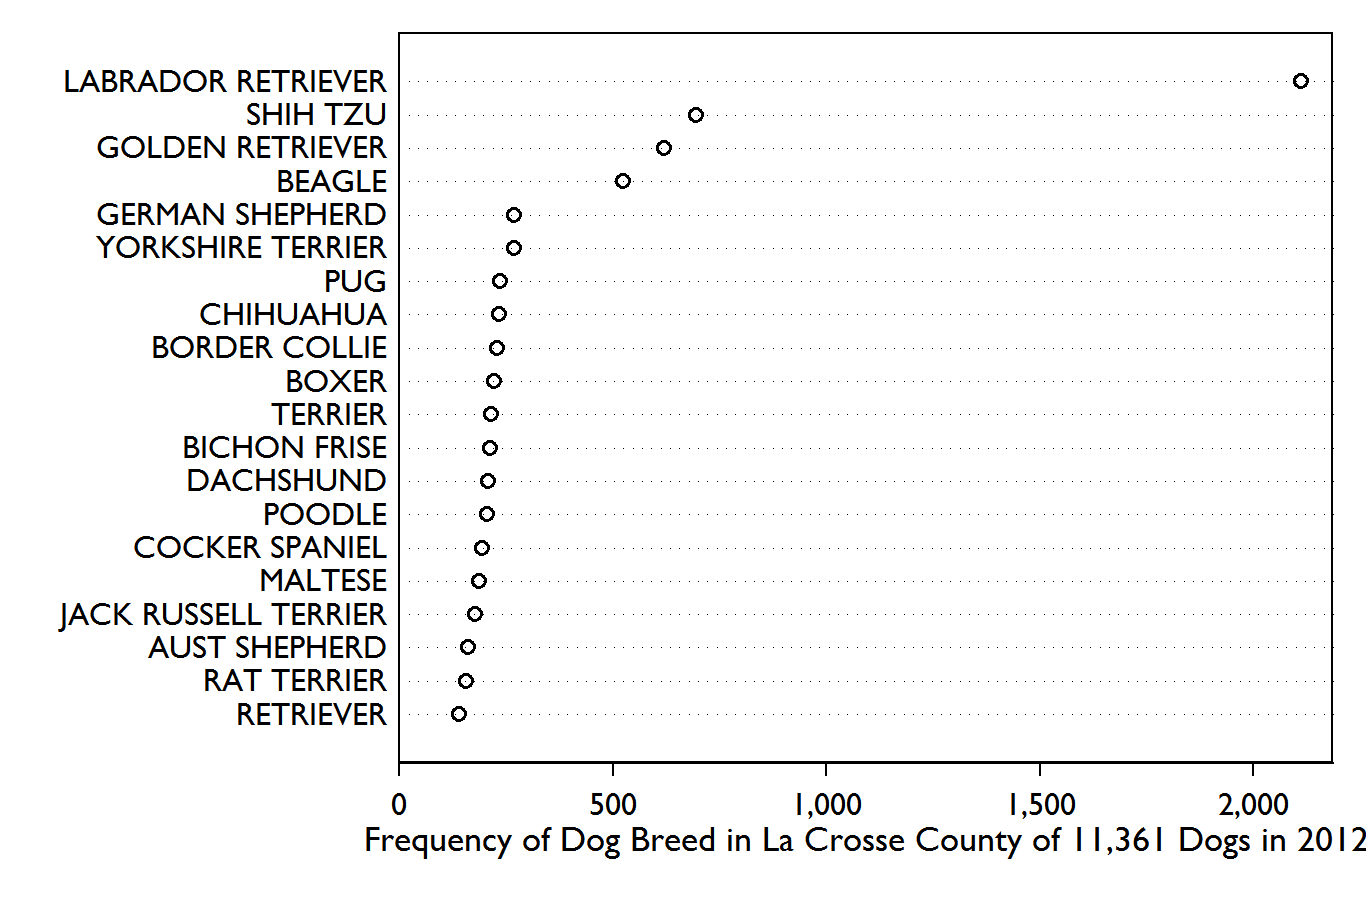
Dog Names and Breeds
I love data. As an Economist and Professor you sometimes find yourself with interesting datasets that need to be shared. I have a group of students doing a project for a dog daycare in town. In order to survey dog owners we got the list of dog licenses from the county. It has the name, address of the owner, and the name, sex and breed of the dog. Below we have the top 20 names for dogs in La Crosse County for 2012. Remember these are licensed dogs.

Below I have the top 20 breeds from La Crosse.


Below I have the top 20 breeds from La Crosse.
Tuesday, January 24, 2012
One Percent
Do you want to join the one percent? Getting a degree from the college of business increases your chances. The NYT breaks down the top one percent by undergraduate degree.


Monday, January 23, 2012
What Not To Do
A great example of how not to design and deliver a presentation. In this commercial Microsoft demonstrates why they suck, or at the very least why their Ad Agency sucks.
Monday, January 16, 2012
Binge Drinking
Below we have a chart that visualizes the rate of binge drinking by state, which I'm grabbing from this blog. The Midwest to some degree, and the colder northern regions to a larger degree, appear to have the highest rates. What are some theories that can explain this relationship?

Monday, January 02, 2012
Krugman
Here is yet another great reason I have trouble respecting Krugman these days. In fact at one point thought I would write a blog post listing all of his intellectual flips, but the list grew too long. As Alex points out at the end:
Now to be fair, Krugman covered himself in 2003 in a credible way he said “unless we slide into Japanese-style deflation, there are much higher interest rates in our future.” Thus, I do not fault Krugman’s forecasting ability. What I do fault is that despite a 180 degree about-face, one thing remains constant in all of Krugman’s writings, anyone who disagrees with him is portrayed as a mendacious idiot. In truth, Heritage today and Krugman 2003 both have legitimate concerns about the long-term debt situation of the United States and it would have been to the credit of Krugman 2012 had he acknowledged that point more fairly.Yeah, Krugman covers his bases so as to have intellectual wiggle room. I get the reasons he does what he does - as a rhetorical style. But as an academic, I don't respect the lack of intellectual honesty and lack of openness Krugman now has. They were qualities I had so admired in the Krugman of old, despite our policy differences.
Subscribe to:
Posts (Atom)